The problems we work on

From raw sensor data to decisions you can defend.

Four areas, one thread: vessel data you can trust, and conclusions you can stand behind.

Data foundation

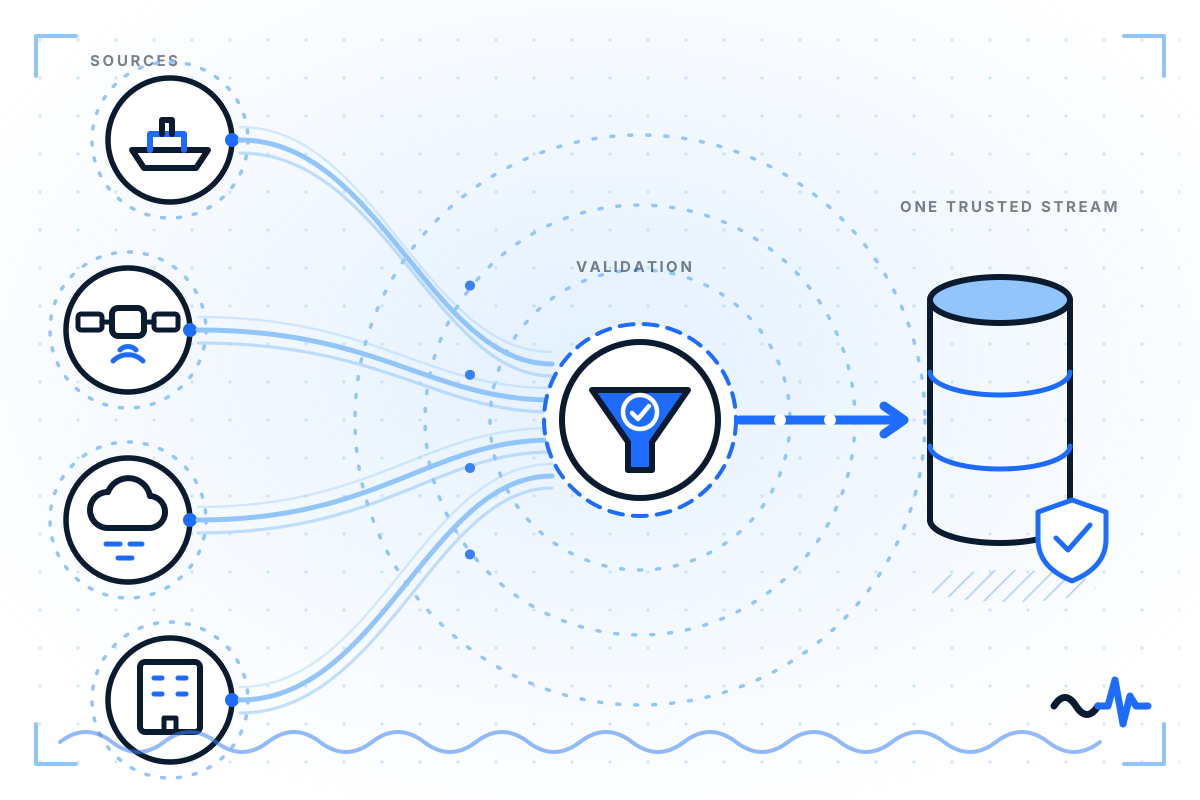
Every analysis stands or falls on the data underneath it. Before any model or report is worth reading, the data has to arrive, be checked, and be stored so it can be trusted — that unglamorous foundation is where we spend much of our time.

Schematic: data from ship, satellite, weather, and office sources passing through validation into one trusted stream

Data integration & management

Vessel data arrives from a dozen incompatible sources — shipboard systems, third-party providers, shore-side databases — each with its own format, frequency, and failure modes.

How we approach it

  • Secure API connections to shipboard systems, third-party providers, and cloud platforms — interoperable by design
  • Automated validation and consistency checks with instant anomaly flagging
  • Database schemas designed for high-frequency vessel and sensor data (keys, indexing, referential integrity)
  • Proactive maintenance: automated backups, restore testing, archiving
Data pipeline

Between a sensor reading and a decision sits a pipeline — acquisition, quality assurance, filtering, transformation. Skip a stage, and the model downstream quietly learns from bad data.

How we approach it

  • Adaptive filtering that removes noise while preserving the signal
  • Continuous sensor-drift and stuck-value detection, flagging or discarding faulty measurements
  • Cross-parameter correlation checks against physical and engineering principles
  • Model-based sanity checks on derived metrics (speed-power curves, efficiency indices) before anything reaches an analysis

Vessel performance

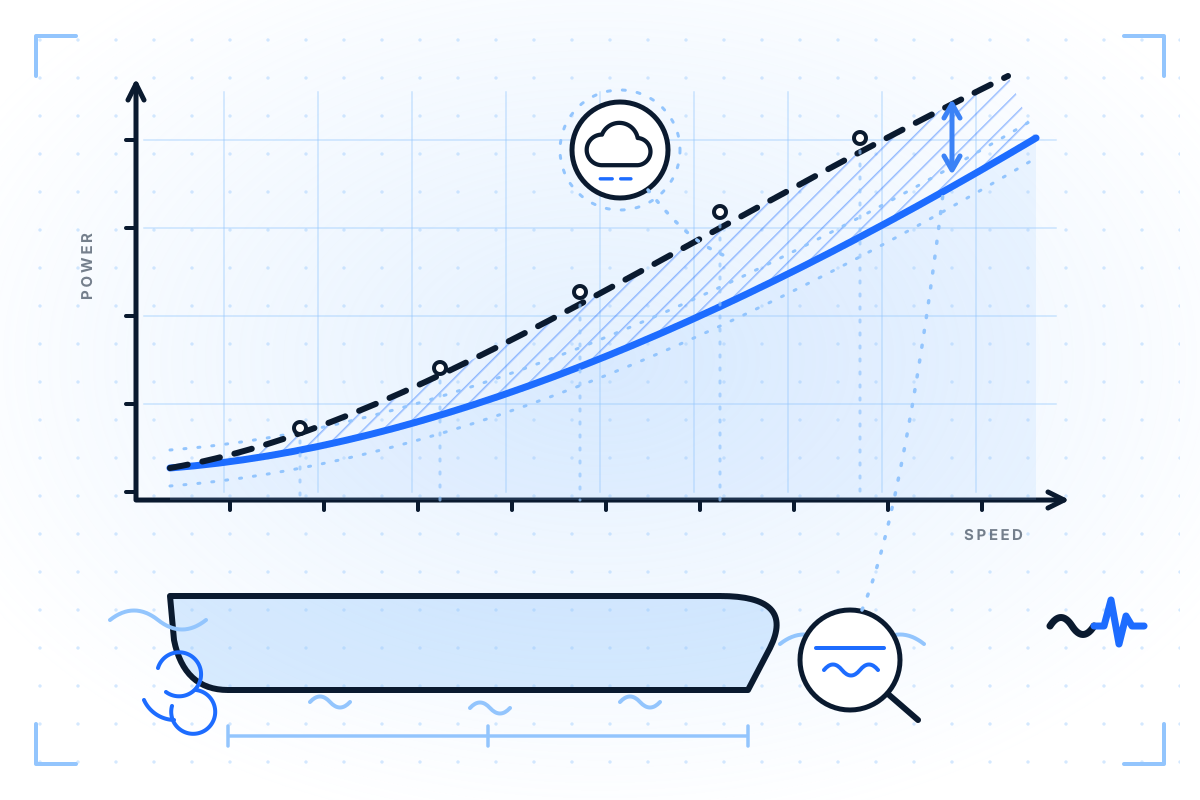
Predicted and actual ship performance rarely agree. The gap has measurable causes — fouling, weather, engine condition, design assumptions — and finding them is the difference between guessing and knowing.

Schematic: expected versus actual speed-power curves diverging above a ship hull, with weather and fouling indicated as causes

Performance monitoring

A hull, propeller, and engine deliver what they deliver — the question is what they should deliver, and what explains the difference.

How we approach it

  • ISO 19030-aligned hull & propeller monitoring: transparent baselines, reliable trend detection
  • Weather-effect estimation: quantifying what wind, waves, and currents cost in power and fuel
  • Digital twins that aggregate sensor data and simulate expected operational states
  • Machine-learning models for fuel consumption and behaviour prediction, trained on quality-checked data
  • Main engine and auxiliaries tracking against shop-test and sea-trial references

Engineering studies

When performance deviates from prediction, someone has to explain where it went — with evidence, not opinion.

How we approach it

  • Sea-trial and model-test assessment: propulsion efficiency and resistance factors, compared properly
  • Sister-vessel comparisons on consistent datasets
  • Deviation studies that attribute the gap between predicted and delivered performance
  • Naval-architecture methods applied to operational data — the physics keeps the statistics honest

Compliance & charter party

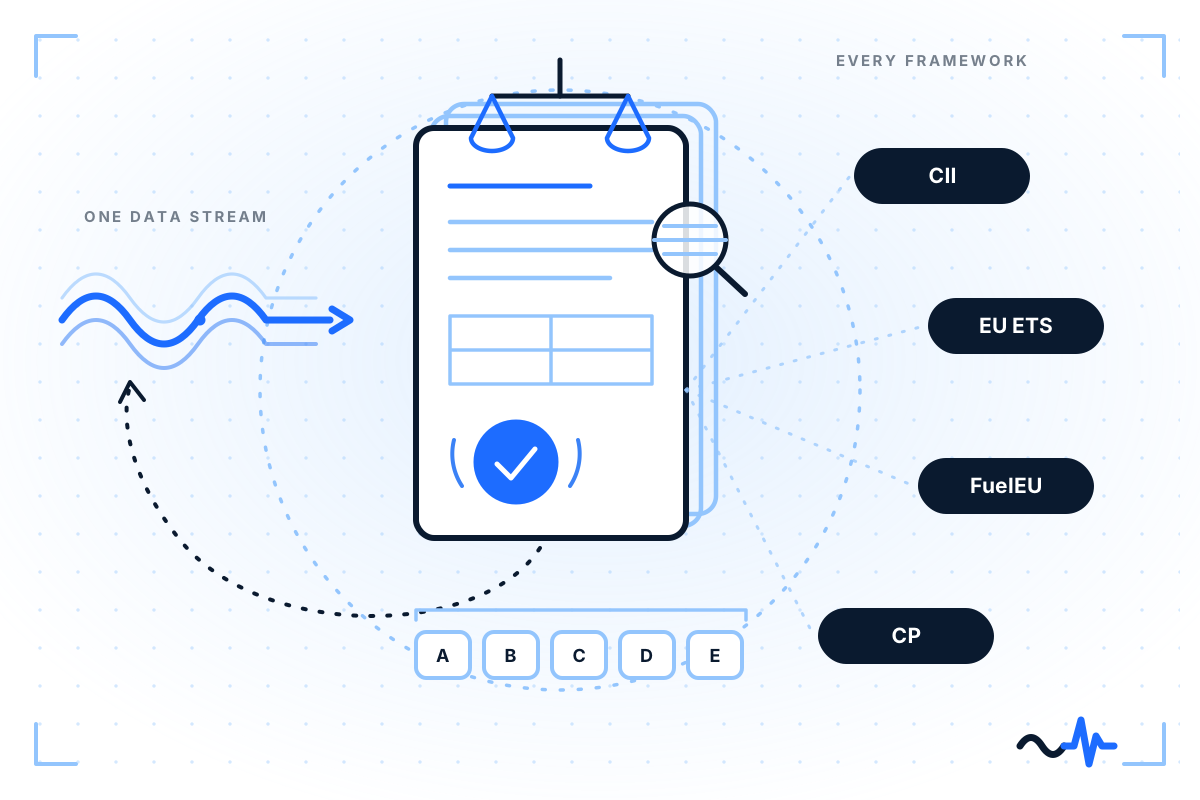
CII, EU ETS, FuelEU, charter party terms — each turns operational data into a number with real financial consequences. Those numbers must hold up when a verifier, authority, or counterparty pushes back.

Schematic: one data stream feeding a verified report, with CII, EU ETS, FuelEU and charter party frameworks alongside

Environmental compliance

A compliance figure is only as good as the data behind it — and it's the shipowner who answers for it.

How we approach it

  • Data-quality checks focused specifically on emissions-critical parameters
  • Automated IMO DCS and CII calculation and reporting
  • EU ETS reporting including EU Allowance (EUA) quantities
  • FuelEU Maritime reporting: tracking and balancing GHG intensity of fuel consumed

Charter party adherence

When a vessel under- or over-performs against charter party terms, the difference is money — and often a dispute.

How we approach it

  • Automated gain/loss calculation for time and consumption on every voyage leg
  • Leg-by-leg performance reports against CP speed, consumption, and arrival terms
  • Weather-normalised benchmarks both owner and charterer can accept
  • CP tables built on accurate speed-consumption relationships

Reporting & AI

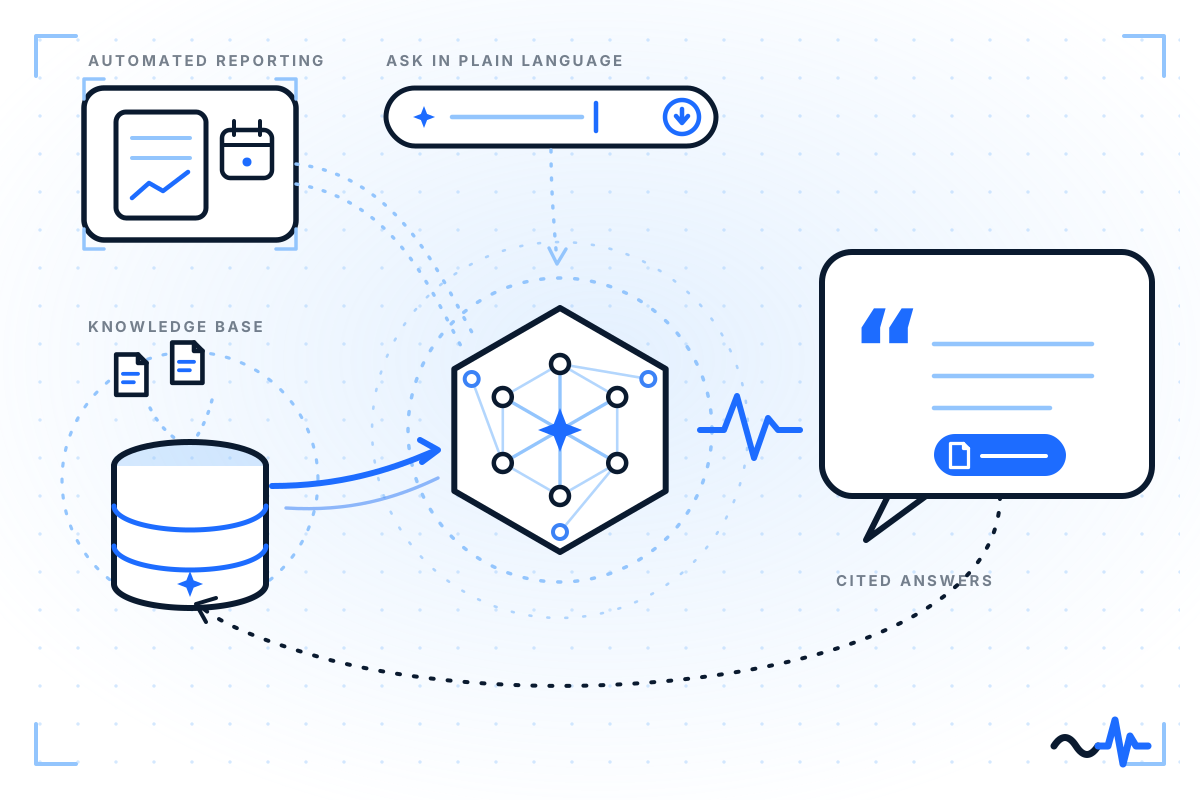
Most fleet data is examined only after something has gone wrong. The last step is making the data speak up on its own — routine reports for the expected, alerts for the exceptions, and answers on demand.

Schematic: routine data becoming reports, exceptions becoming alerts, and questions receiving answers with citations

Automated reporting & alerting

The signal is in the data days before it reaches a meeting.

How we approach it

  • Scheduled reports for operational, compliance, and technical KPIs — daily, weekly, or per voyage
  • Reports that spotlight deviations and emerging trends instead of burying them in tables
  • Near-real-time alerting on abnormal behaviour: speed deviations, route changes, drifting, out-of-range parameters

AI documentation

Technical manuals, class certificates, and procedures hold answers crews need in seconds — not after an hour of searching PDFs.

How we approach it

  • A unified, searchable knowledge base across manuals, certificates, and procedures
  • Retrieval-augmented AI assistants that answer in plain language with citations, so every answer can be checked
  • Automated version control and revision tracking, keeping documentation aligned with current standards
  • Accessible to crews on board and teams ashore, from any device

Educational Seminars & Webinars

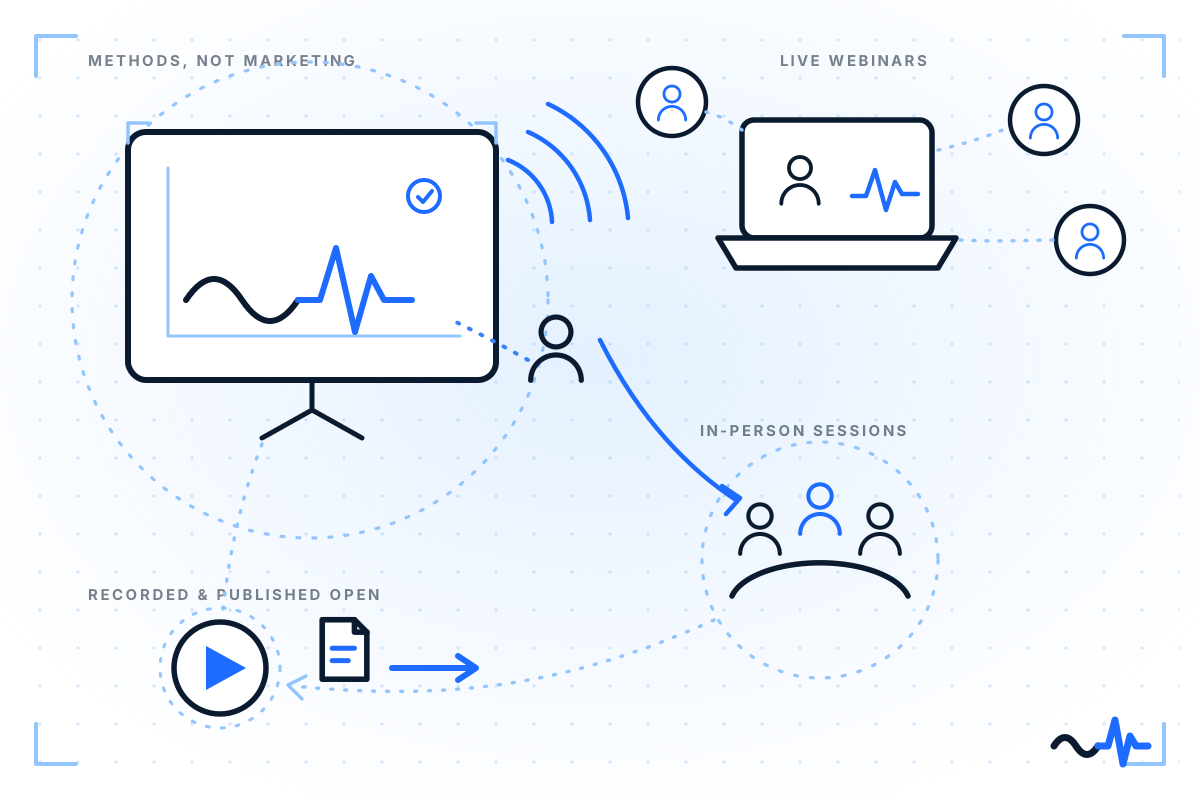
We run open educational seminars and webinars for the maritime industry — sharing the same methods, findings, and hard-won lessons we publish as papers and talks. They are built to help operators and technical teams understand the data behind their decisions, not to sell a platform.

Schematic: open seminars and webinars — live sessions, in-person events, recorded and published afterwards; methods, not marketing

What We Cover

Vessel performance (ISO 19030, hull & propeller condition), maritime data quality and pipelines, environmental compliance (CII, EU ETS, FuelEU), and how physics-based and AI models actually work — explained in plain terms.

Formats

Live online webinars (recorded and published afterwards), in-person sessions at conferences and industry events, and focused workshops that work through real data and real questions.

Who They're For

Shipowners, operators, fleet-performance and technical teams — and anyone who wants to understand the numbers behind decarbonisation and efficiency, rather than just read a dashboard.

We announce upcoming sessions on LinkedIn and through our RSS feed. Past sessions are published as recorded talks.

Interested in attending, or in having us speak at your event? Talk to us →

Working on one of these problems?

Tell us what your data looks like — we'll tell you honestly whether we can help, and point you to the relevant reading either way.

Talk to us about your data