Where the Fuel Goes: A Map of Energy-Saving Measures
Five families of efficiency measures, sorted by where they do their work between the fuel tank and the delivered cargo, plus the three questions that show what any vendor's savings claim is really made of.
Somewhere in your inbox is a brochure promising double-digit fuel savings from a device you had not heard of a year ago. The market for efficiency hardware is crowded, the percentages are confident, and the physics behind them is rarely on the page.
This article opens a new series that puts it back. For six months we have traced where a ship's energy goes: the five components of calm-water resistance, added resistance in weather, and the shallow-water effects that bend the physics near the bottom. This series looks at the other side of the ledger, the technologies sold to claw that energy back, and at how to read a savings claim before you sign for the retrofit.
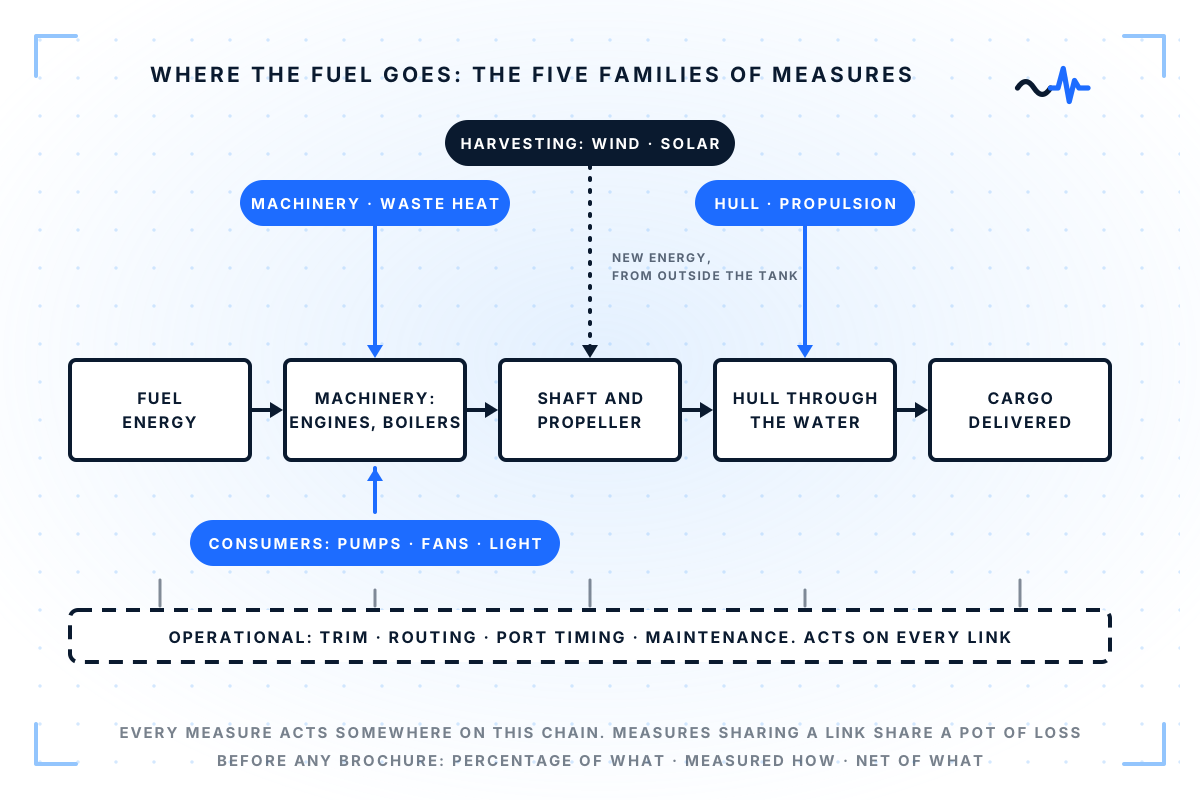
Five families, one energy chain
The most useful map of the territory sorts measures by where in the energy chain they act: fuel → machinery → shaft and propeller → hull through the water → cargo delivered. In other words, by the point between the fuel tank and the delivered cargo at which each one does its work.
Operational measures change how the ship is run: trim optimisation, weather routing, port-call timing, maintenance discipline. They cost attention rather than steel, which is why they should be pushed as far as they will go before any retrofit money is spent.
Hull and propulsion measures reduce what the ship demands from the engine: coatings, hull cleaning, and the fixed geometry around the propeller this series will dissect.
Machinery and waste-heat measures improve how fuel becomes useful work: engine tuning, shaft generators, and recovery of the heat that would otherwise leave through the funnel.
Energy-consumer measures shrink the electrical bill: variable-speed pumps and fans, LED lighting, HVAC control.
Energy-harvesting measures bring new energy aboard from outside the fuel tank: wind-assisted propulsion and solar. A rotor sail does not reduce the hull's demand; it supplies part of the demand for free.
The families are more than filing: they show which measures will get in each other's way. Two measures in the same family are usually drawing on the same pot of loss, so the second works only on whatever the first left behind. The closing article of this series turns that observation into arithmetic.
The sceptic's checklist
Three questions show what a claim is really built on.
Percentage of what? A saving is a comparison, and half of it is the baseline: the reference case the ship is being compared against. Five percent of which ship, at which speed, at which draught, on which route? A device tested on a slow, full-bodied bulker will not repeat its number on a fast container ship, because the resistance it attacks is a different share of the total. A percentage quoted without its baseline tells you nothing you can use. It is an advertisement, not a measurement.
Measured how? There is an evidence ladder. CFD (computational fluid dynamics, the flow simulated on a computer) and model tests predict. A dedicated sea trial measures once, in conditions chosen for the test. Normalised in-service data, readings from the ship's own voyages corrected for speed, loading and weather, measures what the ship actually experiences across seasons and loading conditions. Each rung costs more and proves more. "Verified by CFD" means a modelled estimate. That is legitimate and useful, but it is not the same thing as a measurement on your ship.
Net of what? Many devices have an appetite of their own: compressors, drive motors, control systems, added weight or windage. The gross figure is the saving the physics produces; the net figure is what is left after the device has fed itself, and that is the number that reaches the fuel bill. If a brochure quotes only gross, ask why.
One habit makes every meeting shorter: convert percentages into tonnes early. A 5% saving on a ship burning 30 tonnes a day is 1.5 tonnes a day. Multiply that by fuel and carbon prices and days at sea, and the brochure number becomes a business case you can argue about.
Where the series goes
The next articles take the families in turn: wind-assisted propulsion (lift, not nostalgia); air lubrication and its compressor arithmetic; the energy-saving devices that collect the propeller's leftovers; the machinery room and the plug on the quay. The closer returns to this map with money attached. It covers why savings multiply instead of adding, and what it takes to verify, rather than hope, that a measure delivered.
What is the most confident savings percentage a brochure has ever promised you? And did anyone ever measure it afterwards?